Research on CCS Safety Assessment
CO2 Storage Research Group HOME
Research on CCS Safety Assessment
RITE has promoted technological developments related to storage performance evaluation of a CO2 injection site in aquifer storage, analysis of CO2 behavior in a reservoir and analysis of CO2 migration (leaks) outside the reservoir as a fundamental technology necessary for the establishment of enhanced safety and reliability of CCS as a project sponsored by the Ministry of Economy, Trade and Industry. In addition, RITE is compiling a best practices manual which will serve as guidelines for CCS operators.
R&D conducted by RITE to address technological challenges for CO2 geological storage
![]()

![]()
![]()
Technical challenges correlation diagram
![]()
Evaluation of CO2 Injection Site
For geological CO2 storage in Japan, supercritical CO2 is injected into deep saline aquifers (reservoir). In order to verify the safety and performance of such CO2 storage, it is necessary to characterize a reservoir complex and to evaluate its storage capacity at an initial stage of the CCS project, for example, at the site characterization phase.
In order to make sure that CO2 will be stably stored for a long time, CO2 behavior in the reservoir should be predicted and examined. Injected CO2 replaces formation water in the pore of rocks in the reservoir. The behavior of CO2 depends on porosity, absolute permeability and relative permeability functions of the formation. With these parameters, the extent and state of CO2 in the reservoir can be predicted numerically. A spatial distribution of these parameters in the ground forms a geological model. In order to predict the behavior of the injected CO2 accurately, highly-accurate geological models should be developed.
Geological modeling techniques have been developed by oil and gas companies. They usually use many well log data to build a geological model of a site. In geological CO2 storage projects, however, the number of wells is severely restricted to reduce leakage risks and costs in the projects and as a result their geological information is generally much limited compared to that of oil and gas fields. Thus, the geological models in CO2 storage projects need to be constructed with limited geological information.
RITE have been developing and applying a technique of geological modeling suitable for Japan's heterogeneous formations which consist of sand, mud and gravel to the Nagaoka CO2 Pilot-Scale Injection Site (Iwanohara Test Site in Nagaoka City, Niigata: INPEX CORPORATION). At the Nagaoka site, CO2 of 10,400 tonnes in total was injected into saline aquifer (reservoir) at a depth of 1,100min a period from July 2003 to January 2005.
Nagaoka CO2 Pilot-Scale Injection Test Site
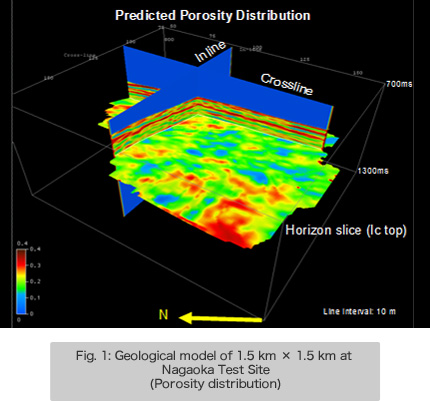
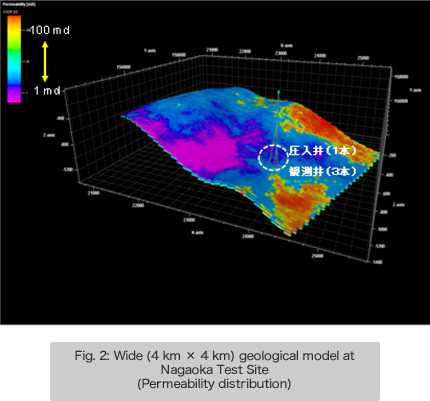
Figures 1 and 2 show geological models at the Nagaoka Site. Figure 1 is a geological model of 1.5 km × 1.5 km made by combining various data from rock core samples, well logging data (one injection well and three observation wells) and three-dimensional seismic explorations. The red areas in the figure represent sandy formations with high porosity, which are suitable for CO2 storage. Figure 2 was a geological model of 4 km × 4 km constructed by stochastic processing based on the spatial distribution of properties of rocks. These geological models are kept updated with data acquired in loggings that RITE periodically conducts.
![]()
Analysis of CO2 Behavior in the reservoir
CO2 injected into deep saline aquifers (reservoir) spreads with replacing formation water in the reservoirs. It is important to confirm how the injected CO2 is distributed and to predict how the distribution changes for safety assessment of geological CO2 storage. RITE investigates the storage mechanism by comprehensively analyzing various data obtained at the Nagaoka CO2 Pilot-Scale Injection Site. Further, monitoring of formation deformation during injection and observation of micro-seismic to monitor, for example, induced seismic activity, are also necessary to ensure safety. These monitoring techniques are referred as CO2 behavior analysis.
Figure 3 shows long-term CO2 trapping mechanisms. There are four mechanisms; structural and stratigraphic trapping, residual CO2 trapping, solubility trapping and mineral trapping (mineralization), and degree of contribution of each mechanism changes as the function of time of post-injection phase. Safety against leakage increases in the order of structural and stratigraphic trapping, residual CO2 trapping, solubility trapping and mineral trapping. Structural and stratigraphic trapping is due to geological structures such as cap rock. Residual CO2 trapping is a mechanism in which CO2 is once captured in small pores, and then cannot move due to capillary pressure. Solubility trapping is a mechanism in which CO2 is dissolved into formation water and then trapped. Mineral trapping is a mechanism in which dissolved CO2 chemically reacts with minerals in the reservoir and precipitates as carbonates.
Analysis of CO2 behavior in Nagaoka Test Site
The Nagaoka Test Site is one of the most valuable test sites in the world since post-injection CO2 behavior has continuously been monitored on a long-term basis. Among these four trapping mechanisms, structural and stratigraphic trapping and solubility trapping mechanisms have been observed, and indications of residual CO2 trapping and mineral trapping mechanisms have been captured from observation data obtained so far.
The figure at the right is a visualization of CO2 distribution in the reservoirs by cross-hole seismic tomography. In pores in rocks, water (liquid) is replaced with CO2 (supercritical state), then seismic wave velocity in the rocks decreases. It is understood from this figure that the injected CO2 is retained below the cap rock. In other words, it is understood that the structural and stratigraphic trapping mechanism is taking place.
It was confirmed that CO2 is safely stored from the results of cross-hole (between OB-2 and OB-3) seismic tomography measurements conducted 5 years and 9 months post-injection.
* The stored CO2 was not affected by the Chuetsu Earthquake (2004) and the Chuetsu-Oki Earthquake (2007).
The figure at the left shows a temporal change of CO2 saturation (the ratio of CO2 in pores) obtained by time-lapse well loggings at an observation well. The result shows that the CO2 saturation becomes nearly a constant value in 4 years after the start of the injection. Because the measurement point is deeper than the injection point, the CO2 with a higher saturation observed until around the end of the 4th year has been migrating, but some part of the CO2 remains at the measurement point. This indicates that the residual CO2 trapping mechanism has been taking place there.
The figure at the right shows results obtained through a different type of physical logging: aging variation of resistivity (electricity flow resistance) at each depth is shown here. The red areas show where resistivity increased due to supercritical CO2 that does not conduct electricity, and the blue areas show where resistivity decreased due to dissolved CO2 that easily conducts electricity.CO2 These phenomena can be interpreted that part of supercritical CO2 has dissolved into water below and above - solubility trapping is taking place.
The last figure shows mineral trapping. Formation water is sampled and analyzed three times: pre-injection, 2 years and 5 months and 8 years and 2 months after the start of injection. The figure at the lower left shows that whereas the total carbonic acid in the formation water increased Ca ion decreased. This is possibly because Ca ion reacted with the dissolved CO2 and precipitated as CaCO3 (calcite). The figure at the lower right shows saturation indexes of calcite, which indicates that calcite precipitates or dissolves depending on the degree of saturation. The saturation index at a depth of 1118 m is positive. This may indicate that there are precipitation of calcite - in other words, mineral trapping has taken place there.
![]()
Visualization of CO2 distribution status by using X-ray CT image analysis
CO2 behavior and the status of replacement of formation water with CO2 when CO2 is injected into samples of rock that forms reservoir can be observed in a non-destructive manner by using an X-ray CT. A CO2 injection experiment of this kind is conducted under temperature pressure conditions where CO2 is brought into a supercritical state because injected CO2 is in a supercritical state in most cases.
RITE is working on technological development in order to quantify the relationship between porosity, degree of fluid saturation and physical properties of rock by analyzing X-ray CT image data. These physical property values can be used for interpretation of monitoring data such as seismic survey data and resistivity data.
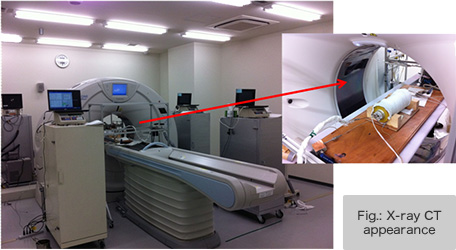
The figures at the left show visualized images of a CO2 distribution state in rock core samples. We can observe how injected CO2 replaces water and enters pores. The injected CO2 is not uniformly distributed in rocks. CO2 is trapped with mixture of high CO2 concentration areas and low CO2 concentration areas in rocks. Analysis of such trapping status contributes to evaluation of actual storable quantities and behavior predictions.
Development of monitoring technology for geological formation stability on CO2 injection
In an overseas CO2 geological storage project (In Salah Project), it was observed that an increase in pore water pressure due to CO2 injection in the storage formation causes a rise of the ground surface around the injection well. If the deformation of geological formations is large, it could damage safety.
Deformation of formations can be observed by embedding underground displacement gauges. It is, however, necessary to determine the embedding depth of the displacement gauges in advance, and only a limited number of displacement gauges can be embedded from an engineering perspective.
RITE is developing a technology to monitor deformations of formations during injection using a distributed-type optical fiber which can continuously measure the deformation in the depth direction. Deformation (strain) of formations is measured by measuring and analyzing scattered light of a pulse laser beam passed into the core of the optical fiber. Further, because the optical fiber sensor can also continuously measure temperature and pressure, it may be possible to widely use the optical fiber sensor as a monitoring system such as post-injection monitoring of leaks from the reservoir in a period, and RITE is promoting the technological development of such sysmems.
Long-term field observation test for permanent OBC(Ocean Bottom Cable)
Seismic surveys are most-widely used for monitoring of CO2 geological storage.
Oscillating seismic waves and receiving their reflected waves can clarify underground structure and CO2 distribution state in formations.
Surveys of storage under the seabed is usually carried out with a ship towing so-called streamer cables, which are cables equipped with a number of sensors, on the sea surface. On the other hand, permanent OBC (Ocean Bottom Cable) has sensors settled on the seabed. There is an advantage that the accuracy of repeated measurements is high because of the fixed sensors.
Furthermore, and the seismic survey with the streamer cables requires a large ship and also a large space on the sea as multiple oscillation-receiving sensors are towed. The survey using the permanent OBC, by contrast, only requires a small ship for oscillation.
In addition,the permanent OBC can observe measure natural earthquakes and microseismic events induced by CO2 injection.in a real-time basis.
RITE conducted actual offshore area tests for the permanent OBC off the coast of Hiratsuka in Kanagawa from 2011 to 2012, and carried out seismic surveys and verified long-term stability and durability of the system.
The permanent OBC system is installed at the site of CCS demonstration project which is conducted by Japan CCS Co., Ltd., sponsored by the Ministry of Economy, Trade and Industry, in Tomakomai-City, Hokkaido.
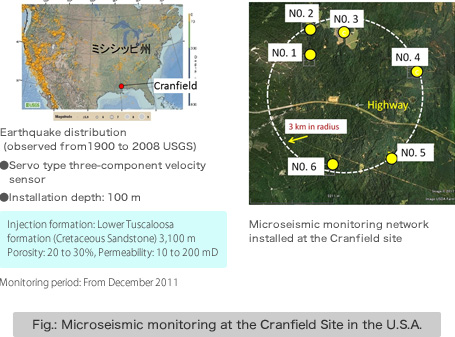
Development of an integrated CO2 injection induced microseismicity evaluation method
The number of microseismic monitoring studies conducted for overseas CO2 injection sites is very limited and most of them were conducted for areas with low seismicity. In earthquake-prone countries like Japan, this kind of study should be essential from the viewpoint of gaining public acceptance. RITE, therefore, develops an evaluation methodology for CO2 injection induced microseismicity to secure safe CO2 injection operation.
RITE develops mainly three kinds of methods: 1) a method to measure and locate microseismicity at a high accuracy, 2) a method to judge that an observed seismic event is caused by a natural earthquake or CO2 injection and 3) a method to manage CO2 injection based on the analysis of real-time data recorded at a CO2 injection site.
RITE has been monitoring microseismicity at a CO2 injection site (Cranfield oilfield, Mississippi, the U.S.A.) since December 2011, collaborating with the Lawrence Berkeley National Laboratory and the Bureau of Economic Geology, the University of Texas. The oilfield is one of the injection test sites run by the Southeast Regional Carbon Sequestration Partnership (SECARB), one of the seven regional carbon sequestration partnerships funded by the U.S. Government.
We study the relationship between CO2 injection and occurrences of microseismicity by analyzing the recorded data.
![]()
Analysis of CO2 Migration from Storage Formation
RITE conducts research on the assumption that CO2 has leaked in an offshore area from the viewpoint of safety assessment. CO2 leaked from the seabed diffuses into seawater. How the leaked CO2 diffuses depends on the flow and temperature of seawater. RITE is conducting research to numerically model the status of the ocean and to predict diffusion through simulations.
RITE sorted out data regarding what levels of CO2 concentration could impact what kinds of marine organisms and complied the results in database. .The database is annually updated with accordance with latest research outcomes published each year.
In addition, RITE carries out technological development in order to detect CO2 that has leaked into offshore areas. RITE conducts studies on the appropriate method to determine whether CO2 that has dissolved in seawater is within the variations of natural phenomena or can be attributed to leaks of CO2.
Furthermore, applicability of an acoustic probing method such as side-scan-sonar (SSS) for detection of CO2 bubbles is also examined.
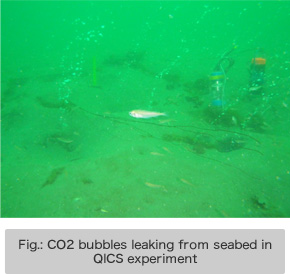
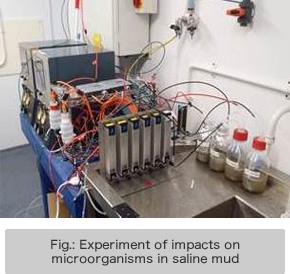
In order to further understand the impact of CO2 on the marine environment, RITE is conducting a field experiment (UK QICS Project: Quantifying and Monitoring Potential Ecosystem Impacts of Geological Carbon Storage) where CO2 is intentionally released from the seabed with research institutes in the U.K. In this experiment, RITE is researching the change in behavior of large benthonic organisms and impacts on microorganisms in saline mud, etc.
![]()
Compilation of Best Practice Manual toward Commercialization of CCS
The first CO2 aquifer storage project was started at Sleipner, Norway in 1996. After the that, many CO2 geological storage projects were started in the world-. The obtained knowledge and experience was summarized as Best Practice Manual or Recommended Practice Manual.
For example, the European Commission provided Guidance Document published in four. These Guidance Documents "CCS directive" to present rules related to CCS implementation to the EU member countries. On the other hand, the United States EPA (Environmental Protection Agency) provided many "Class VI Well Guidance". DOE(The United States Department of Energy) was promoting preparation of a BPM based on the knowledge experience of the CCS projects of the RCSP (Regional Carbon Sequestration Partnership). As described above, accumulated experience and knowledge of pilot-scale tests involving CCS projects are analyzed and reviewed and adopted, and preparations are being made overseas for full-scale implementation of CO2 storage underground and seabed formations.
Primary instruction manuals and guidelines related to CCS
| Organization | Published instruction manuals and Guidelines | |
|---|---|---|
| United States | EPA | Guidelines for class VI CO2 storage wells |
| DOE/NETL | BPM series for CO2 Storage | |
| Canada | CSA | CCS international standardization |
| Europe | EC | Guidance for CCS directive for member countries |
| Japan | METI | Document for Large-scale demonstration Test |
| ENV | Guidelines for applying offshore CO2 storage | |
| International organizations |
CSLF | Comparison of BPM |
| WRI | CCS Guidelines Community Engagement |
|
| IEAGHG and Others |
BPM of Project-Weyburn | |
| Private Organization |
DNV | Recommendation on certifying CCS project |
Purpose and image of Best Practice Manual compilation
| Content | |
|---|---|
| Purpose | 1. Implementation of technically safe and economically viable CCS project - Ensuring economic efficiency, safety, legal compliance, and consensus formation - Reduction of in dissemination of CCS |
| Image of Best Practices | 2. Support for transmission in dissemination of Japanese technological Competence - Expansion of project outside Japan, participation in international joint research - Alignment with international standardization activities, cooperation with international organizations |
A diagram for compilation of the best practices manual is shown below. As a first step, relevant information is collected from within Japan and overseas, sorted and analyzed, and in parallel key aspects and major data of the Nagaoka CO2 Pilot-Scale Injection Test are sorted out and summarized. Then, based on results from research and development conducted by RITE, a RITE version of the CCS best practice manual is compiled, and as a final step, a Japanese version of the CCS best practices manual is to be developed, incorporating the large-scale demonstration project in Japan.
![]()
![]()
9-2, Kizugawadai, Kizugawa-Shi, Kyoto,
619-0292 JAPAN
TEL 0774-75-2309 FAX 0774-75-2316
![]()
![]()
Download Adobe®Reader® to view on PDF files. Adobe Reader, available for free from Adobe.
Copyright © Research Institute of Innovative Technology for the Earth. All Rights Reserved.